Written by: Ed Orlando, Data Scientist
Project Description
Reducing turnover in an organization is vital. Using a fabricated data set, this project utilized advanced machine learning methods that accurately predicted which employees have a higher or lesser likelihood to leave. This project also displayed which key features influenced Employee Attrition at both the macro level as well as at the individual employee level.
Acknowledgement
I want to thank and give credit to Matt Dancho, CEO and Founder of Business Science University. The advanced machine learning methods taught in his courses were heavily implemented in this application. Business Science University is truly an end-to-end journey that gently walks you through how professional data scientists set up, build, and deploy bleeding edge machine learning models.
Contents
- Data Descriptions, Correlations, and Variable Importance
- H2O’s GBM Model Metrics
- Top 15 Employees Most Likely to Leave
- Explain Why Individual Employees Are Likely to Leave Using Shapley
- Takeaways and Next Steps
Interactive Web Application
Click here for an interative Shiny application that lists the individual employee risk of leaving. More importantly, it describes the features that associated with that individual employee risk level.
1. Data Descriptions, Correlations, And Variable Importance
This application utilized a dummy data set provided by Business Science University’s 201 course. The attributes used in the prediction model included items such as:
- Overtime
- Education & Experience
- Engagement
- Department & Position
- Demographics
- Performance
- And More…
Correlation Funnel
The Correlation Funnel below examined each of the features in the model and identified the Top 10 relationships with Employee Attrition. The features most highly associated with Attrition include Overtime, Monthly Income, and Stock Option Levels.
The viz below is interactive and more information related to the associations can be viewed by hovering over each of the circles above.
H2O’s Variable Importance Plot
Similar to the Correlation Funnel shown above, the features that heavily influenced the predictive model were identified using H2O’s Variable Importance Plot (VIP) which can be viewed below.
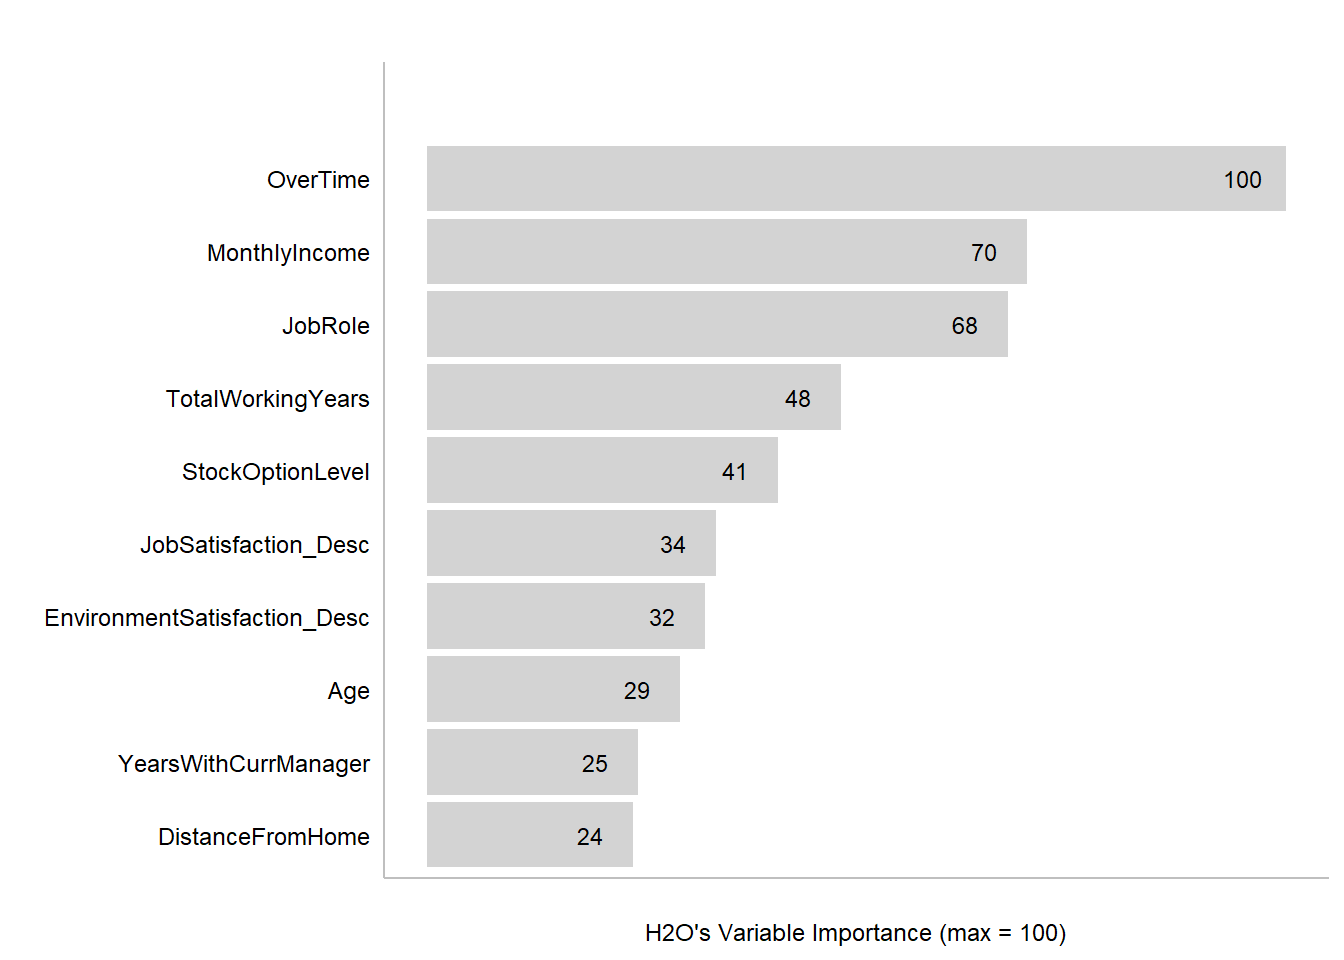
One major difference between the two methods is that the Correlation Funnel examined the relationships on a linear scale, while H2O’s VIP calculated the relationships using tree-based methods.
The other key difference is that the Correlation Funnel broke up the features into smaller bins so that one can see how the various factors or quartiles influenced attrition. In the Correlation Funnel, Overtime was broken out into “Yes” and “No” levels of detail. Although Overtime was labeled as the most important feature the H2O Importance Plot, that next layer of detail was not provided.
Key Features Comparison: Correlation Funnel versus H2O’s Variable Importance Plot
The Correlation Funnel and the Variable Importance Plot provided very useful information about the data. Both plots showed similarities based on how each ranked the importance of the features. For example, Overtime, Monthly Income, and Stock Option Levels were all Top 5 influencers in both the Correlation Funnel as well as H2O’s VIP.
However, there were some differences in how each of them ranked the key features and their relative influence. For example, the Correlation Funnel listed Marital Status as one of the top 5 key contributors, while H2O’s VIP did not even list it in the Top 10.
Regardless, both the Correlation Funnel and H2O’s Variable Importance Plot compliment each other well and they should both be looked at during the EDA phase of the data analysis.
2.0 H2O’s GBM Model Metrics
H2O’s AutoML Gradient Boosting Model (GBM) was applied to predict Employee’s Attrition likelihood of leaving. The GBM was the most accurate individual model (lowest logloss). The entire model cross-validation accuracy metrics are listed below.
- Logloss: 0.323
- AUC: 0.833
- Accuracy: 0.882
- Recall: 0.626
- Precision: 0.645
Note: The percentage of individuals that were termed in the data set was 237 compared to 1,233 currently with the company. This calculated to a base attrition ratio of 19.2%. The model accurately identified 62.6% of the individuals most likely to leave. This means that the GBM model was 2.3x more likely to predict someone leaving versus random selection.
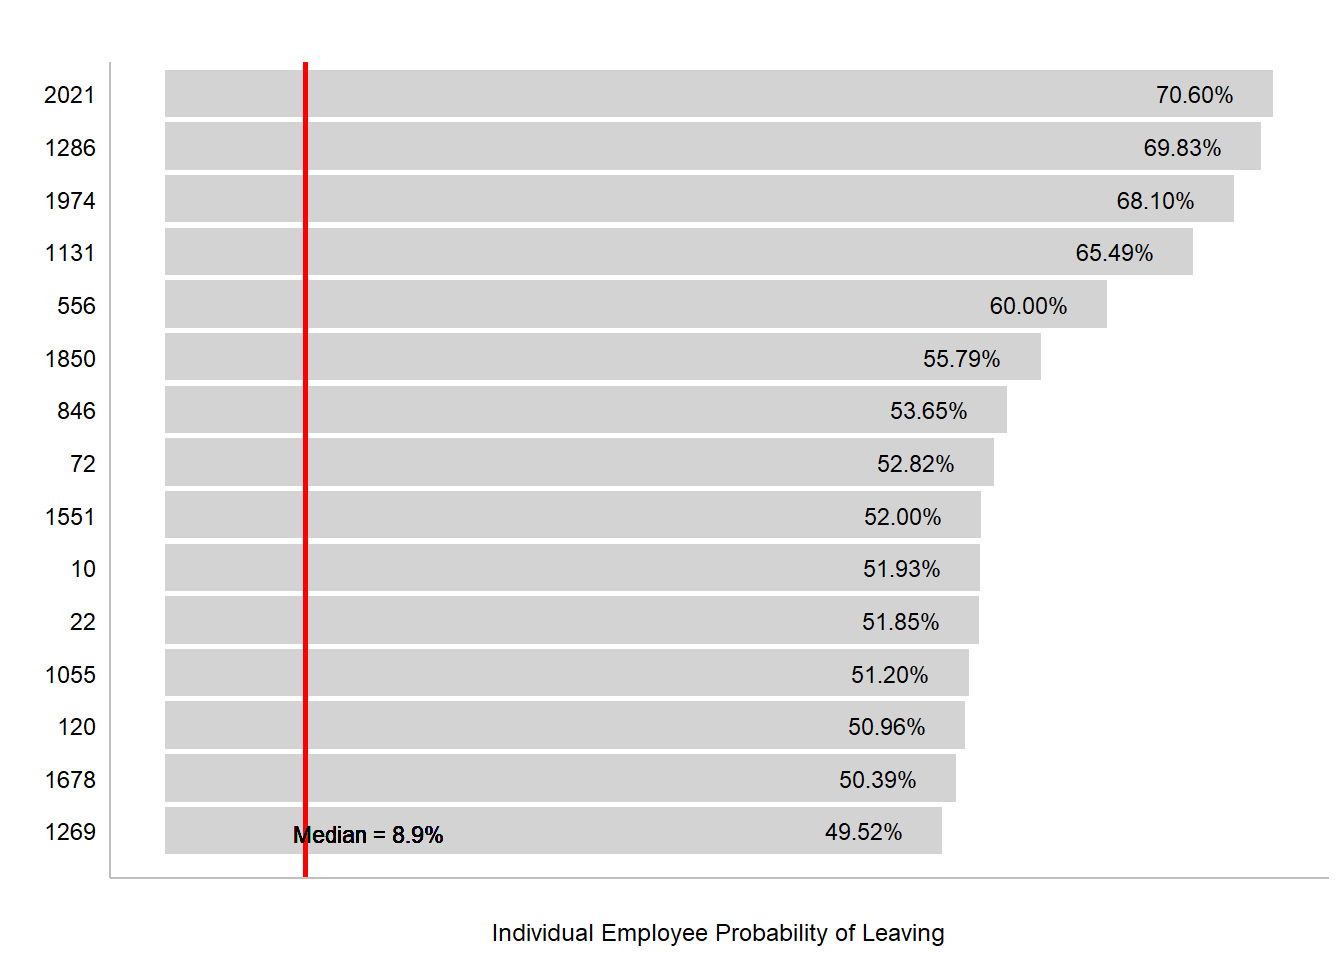
3.0 Top 15 Employees Most Likely to Leave
The associates still employed by the company and have the highest likelihood of leaving are listed below. Employee Number 2021 has a 70.6% probability of leaving the company compared to the median probability of 8.9%. These are the associates that need to be most heavily monitored. The company should also develop action plans to retain these associates, especially if they are strong performers.
4.0 Explain Why Individual Employees are Likely to Leave Using Shapley
Before developing an action plan to retain employees, the manager first needs to know why an individual was identified as a high risk of leaving. In the previous section, Employee 2021 was identified as a high risk. The probability of the individual leaving was 70.9% compared to a median probability of all other employees at 8.9%. In the chart below, we highlighted the Top 5 features that influenced Employee 2021’s probability. The bars listed in red all support the individual’s chance of leaving, while the gray bars (if applicable) support the individual’s chance of staying.
ML Explanation Using Shapley
Employee ID 2021 (Probability of Leaving = 70.6%)
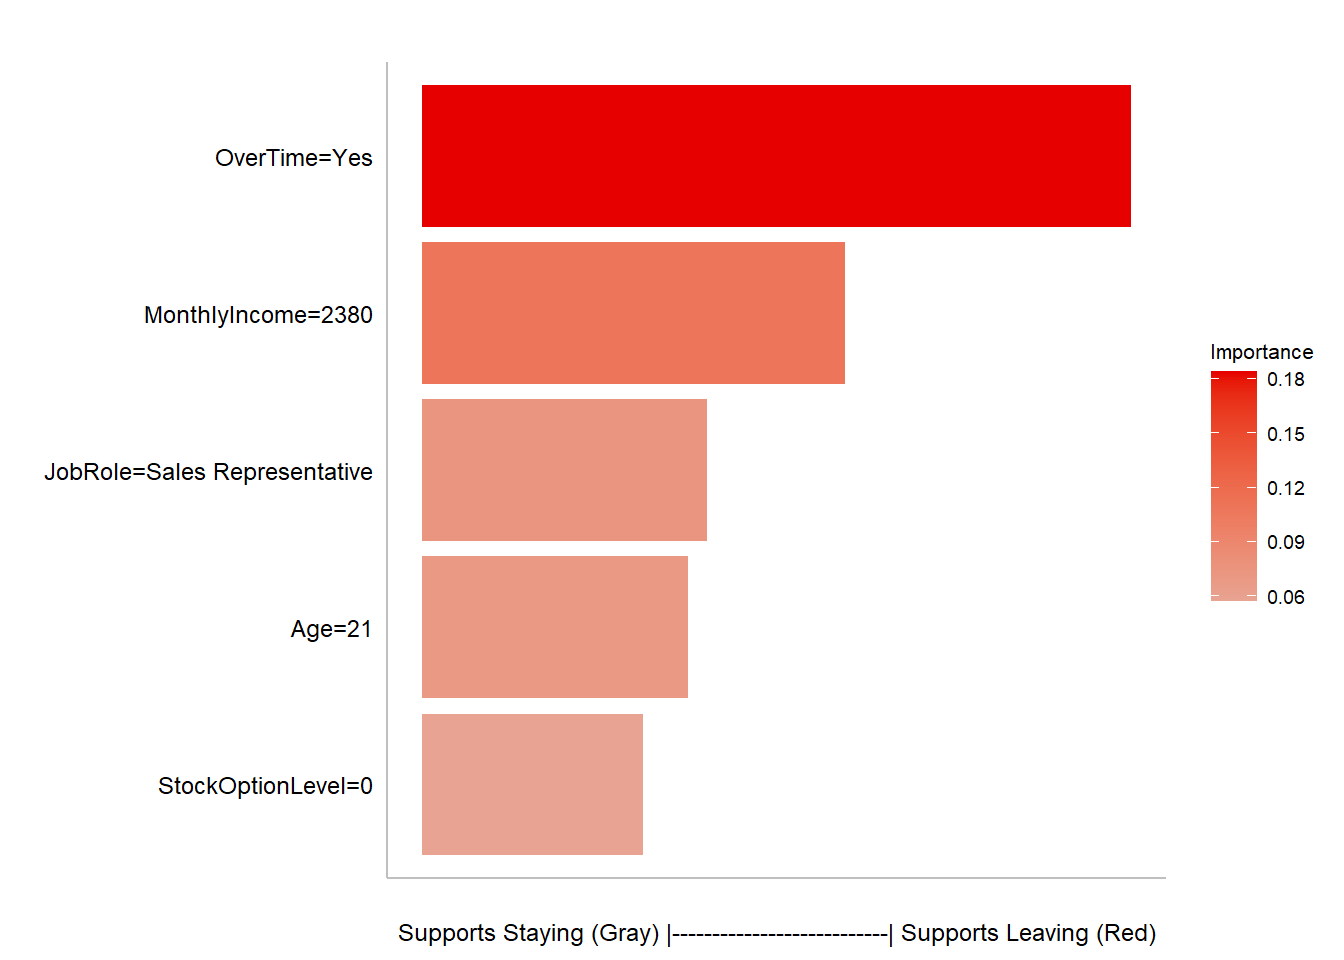
Employee 2021 was listed as likely to leave since the employee works overtime, the monthly income is comparatively low, age is equal to 21, the position is a Sales Rep, and the employee does not have any Stock Options. Some of these items are not actionable, but a manager might be able to reduce overtime in the department as well as talk to HR regarding Stock Option Level opportunities for all associates.
A method called Shapley was used to calculate the features that influenced the employee’s probability. Shapley “is a method from coalitional game theory that produces what’s called Shapley values (Lundberg & Lee, 2016). The idea behind Shapley values is to assess every combination of predictors to determine each predictors impact” http://uc-r.github.io/iml-pkg#shap.
If you want view the features that influence other Employees, click the here and change the Employee Number.
5.0 Takeaways and Next Steps
This application walked you through the various machine learning models used to identify what features influenced Employee Attrition both at a global level as well as a local level. It also allows viewers to interact with the local explainers by changing the employee numbers in the Employee Attrition Shiny App.
For questions related to this analysis, please message me on LinkedIn.
For access to more articles, please check out my blog.